Over 5 million people live in South Carolina. Many of these people have experienced natural disasters in the state firsthand or had to evacuate because of disasters. However, many South Carolinians don’t realize just how many types of natural disasters can occur in the state.
This analysis covers what natural disasters occur in South Carolina, the worst natural disasters to hit the state since 2000, and what residents can do to prepare.
Is South Carolina At Risk of Natural Disasters?
Compared to the rest of the United States, South Carolina has a low risk of natural disasters. Excluding COVID, South Carolina has had 28 disaster declarations since 2000. Of these, 16 were declared major disasters.
South Carolina is also frequently hit by natural disasters, which cause more than $1 billion in damages. Since 2000, more than 60 separate $1-billion events have affected South Carolina. Most of these were severe storms or tropical cyclones.
Worst Natural Disasters in South Carolina By Cost (Since 2000)
- Hurricane Ian 2022: $112.9 billion
- Hurricane Irma 2017: $60.5 billion
- Hurricane Michael 2018: $29.5 billion
- Hurricane Florence 2018: $28.3 billion
- Hurricane Charley 2004: $25.1 billion
Worst Natural Disasters in South Carolina By Deaths (Since 2000)
- Hurricane Ian 2022: 152 deaths
- Spring-Fall Drought and Heat Wave: 140 deaths
- Hurricane Irma 2017: 97 deaths
- Spring-Summer 2011 Drought and Heat Wave: 95 deaths
- December 2022 Winter Storm and Cold Wave: 87 deaths
*Cost and death tolls are for the entire disaster, including in other states affected.
Most Common Natural Disasters in South Carolina
1. Flooding
South Carolina has 187 miles of coastline and 30,000 miles of rivers and streams. Because of increasing sea levels and frequency of tropical storms, coastal areas of South Carolina are at high risk for flooding. The state also receives more rainfall than in the past, so even inland parts are at risk of flooding.
Because of climate change, the risk of flooding will only worsen in South Carolina. The state ranks #5 in the country for greatest increase of properties at significant risk of flooding by 2050.
South Carolina Flood Stats
- 271,500 properties at substantial risk in 2020
- 430,800 properties at risk by 2050
- 316,900 properties at substantial risk by 2050
- 55,900 properties at almost certain risk by 2050
- 294,100 FEMA flood damage claims since 2000
Which Areas of South Carolina Are Most At-Risk of Flooding?
Floods can occur in all parts of South Carolina, but some areas of the state are particularly at-risk. Below are the areas of South Carolina with the greatest percentage of properties likely to experience flooding (based on 2020 calculations).
- Seabrook Island: 98%
- Isle of Palms: 97%
- Kiawah Island: 95%
- Edisto Beach: 93%
- Hilton Head Island: 91%
- Folly Beach: 90%
- James Island: 82%
- Charleston: 59%
- Port Royal: 54%
Because of climate change, the risk of flooding is increasing in many parts of South Carolina. For example, by 2050, an estimated 67% of all properties in Charleston will be at risk of flooding.
2. Hurricanes
South Carolina is one of the most at-risk states in the country for tropical storms and hurricanes. From 1851 to 2020, the state was hit by 31 hurricanes. This ranks South Carolina as #5 in the country for hurricane frequency. Of these, 17 were Category 1, and 9 were Category 2.
Approximately 27% of North Carolina’s population lives in coastal areas. These areas are particularly susceptible to hurricane damage. Because of this, in 2022, North Carolina ranked #7 in expected hurricane damage losses per capita.
3. Wildfires
South Carolina is one of the region’s most at-risk states for wildfires. It has thousands of wildfires yearly, many of which quickly grow into large ones. Since 2000, South Carolina has declared disaster four times because of wildfires.
Luckily, the state does practice controlled burning to minimize damage. Most of the state’s wildfires occur during late winter to early spring when there is lots of dry debris on the ground. Careless burning of debris is the leading cause of wildfires in the state.
Because of climate change, the risk of wildfires in South Carolina is growing. By 2050, an estimated 85% of all properties in the state will be at risk of wildfire.
South Carolina Wildfire Stats
- Acres burned since 2002
- Acres burned in 2021: 7,337
- Number of fires in 2021: 630
- Average number of wildfires per year: 5,000
- Average number of acres burned per year: 30,000
- Percentage of state covered by forests: 67%
- Number of properties currently at risk of wildfire: 2,068,048
4. Earthquakes
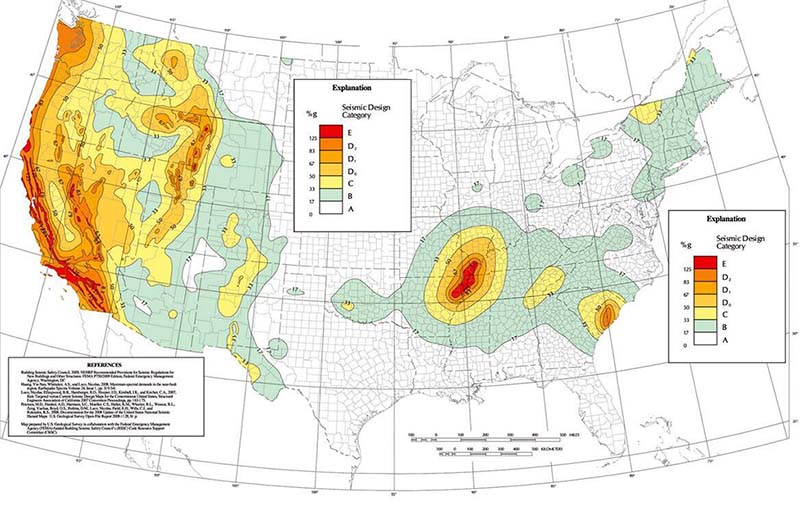
South Carolina doesn’t have earthquakes frequently. On average, it only has 2 to 5 earthquakes each year which are strong enough to be felt. However, the state has the potential for powerful, damaging earthquakes.
For example, Charleston had a magnitude 6.9-7.3 quake in 1886. If an earthquake of this intensity were to occur today in Charleston, it could cause 45,000 causalities and displace 200,000 people. A significant earthquake would also disrupt power and water services.
The cause of earthquakes in South Carolina isn’t clear. Earthquakes in the state occurred within a plate and not at a plate boundary. Some quakes may be caused by artificial activities, such as when wastewater from the oil and gas industry is injected into the ground.
5. Tornados
South Carolina has an average of 24 tornadoes yearly, but most are weak. However, South Carolina does occasionally get strong tornadoes. In April 2020, there was an F4 tornado that caused 5 deaths and 60 injuries. An F3 tornado on the same date killed 2 and injured 7.
Because of this, South Carolinians should ensure they are prepared for tornadoes. They need to know what to do during a tornado, have an above-ground storm shelter, and have an emergency all-weather radio with alerts for tornados.
6. Heat Waves and Droughts
As with the rest of the country, the risk of heat days is increasing in South Carolina. South Carolina averages 25 “dangerous” heat days per year. The National Weather Service defines these as days where the heat index is 103F or above.
By 2050, the number of dangerous heat days in South Carolina is expected to increase to 90 days per year. The number of heat wave days is expected to increase from 15 to nearly 60 days yearly.
In addition to more dangerous heat days, South Carolina will see more “Local Hot Days.” Local Hot Days are “Days at or above the 98th percentile temperature, or the temperature that an area could expect to see on the hottest 7 days of the year.” Essentially, Local Hot Days factor in what temperatures a local population is used to experiencing.
An increase in Local Hot Days is associated with health problems like strokes, and heat-related deaths are more likely to occur. Energy demands also increase from air conditioning use.
All parts of South Carolina are expected to have an increase in Local Hot Days, but Charleston County is particularly at-risk. By 2053, Charleston will have 19 consecutive days with temperatures at or above 105.6℉.
Droughts often accompany heat waves. These droughts can have a huge economic impact on South Carolina’s agricultural economies and strain water resources.
7. Lightning
South Carolina is one of the most at-risk states for lightning strikes. Each year, the state experiences approximately 14.6 lightning strikes per square mile. This high lightning density explains why South Carolina ranks #13 for lightning deaths in the country.
https://www.epa.gov/climate-indicators/climate-change-indicators-heat-waves
https://www.c2es.org/content/heat-waves-and-climate-change/
https://worldpopulationreview.com/state-rankings/average-snowfall-by-state
http://www.usa.com/rank/us–average-snow–state-rank.htm
http://www.usa.com/rank/us–average-snow-days–state-rank.htm
https://clearsurance.com/blog/states-with-most-fatal-winter-crashes
https://www.moneygeek.com/insurance/auto/analysis/worst-states-winter-driving/
https://www.currentresults.com/Weather-Extremes/US/snowiest-day.php
https://www.infoplease.com/math-science/weather/record-lowest-temperatures-by-state
https://www.discovermagazine.com/environment/welcome-to-hail-alley-a-u-s-region-prone-to-pelting-ice
https://www.moneygeek.com/insurance/homeowners/analysis/top-states-for-hail-losses/
https://wgntv.com/weather/weather-blog/where-does-hail-occur-most-often-in-the-united-states/
https://stacker.com/weather/states-most-hailstorms
https://www.verisk.com/insurance/capabilities/weather-risk https://www.iii.org/fact-statistic/facts-statistics-wildfires
https://www.globalforestwatch.org/dashboards/country/USA/11/119
https://www.verisk.com/
https://www.moneygeek.com/insurance/homeowners/analysis/wildfire-statistics/#wildfires-by-state
https://www.geographyrealm.com/geography-hail-united-states/
https://www.weather.gov/media/safety/59-16_State_Ltg_Fatality%2BFatality_Rate_Maps.pdf
https://www.livescience.com/14714-lightning-prone-states-110620.html
https://www.statista.com/statistics/1292499/leading-states-by-total-lightning-count-us/
https://www.earthnetworks.com/blog/states-most-lightning-strikes/
https://www.worldatlas.com/articles/the-five-most-lightning-prone-states-in-the-united-states.html
https://www.moneygeek.com/insurance/homeowners/analysis/top-states-for-hurricane-losses/
https://www.statista.com/statistics/1269483/number-of-hurricanes-that-made-landfall-in-the-us-state/
https://coast.noaa.gov/states
https://assets.firststreet.org/uploads/2020/06/first_street_foundation__first_national_flood_risk_assessment.pdf
https://floodlist.com/