
Over 12 million people live in Illinois. Many of these people have experienced natural disasters in the state firsthand or had to evacuate because of disasters. However, many Illinois residents don’t realize just how many types of natural disasters can occur in the state.
This analysis goes over what natural disasters occur in Illinois, the worst natural disasters to hit the state since 2000, and what residents can do to prepare.
Is Illinois At Risk of Natural Disasters?
Compared to the rest of the United States, Illinois has a medium risk of natural disasters.
Since 2000, Illinois has had over 20 disaster declarations. Illinois is also frequently hit by natural disasters, which cause more than $1 billion in damages. Since 2000, there have been more than 83 separate $1-billion events.
Worst Natural Disasters in Illinois By Cost (Since 2000)
- Hurricane Ike 2008: $40.8 billion
- 2012 Heat Wave and Drought: $39.3 billion
- February 2021 Winter Storm and Cold Wave: $25.6 billion
- Spring-Summer 2011 Heat Wave and Drought: $16.2 billion
- Spring-Fall 2002 Drought: $15.1 billion
Worst Natural Disasters in Illinois By Deaths (Since 2000)
- April 2011 Tornado Outbreak: 321 deaths
- February 2021 Winter Storm and Cold Wave: 262 deaths
- May 2011 Tornado Outbreak: 177 deaths
- 2012 Heat Wave and Drought: 123 deaths
- Hurricane Ike 2008: 112 deaths
*Cost and death tolls are for the entire disaster, including in other states affected.
Most Common Natural Disasters in Illinois
1. Flooding
Many parts of Illinois are at high risk for flood disasters. Floods often occur in the state because of snowmelt and ice jams can cause river flooding. Runoff is also a big problem in the state because many upland areas have been urbanized. As a result, heavy rains and storms can cause floods and mudslides. Nearly 9% of all properties in Illinois are at substantial risk of flooding. More than ¼ of all properties in Chicago are at risk of flooding.
Illinois Flood Stats
- 246,000 properties at substantial risk in 2020
- 154,824 properties in Chicago at risk of flooding in 2020
- 378,800 FEMA flood damage claims since 2000
- 748,100 properties will be at risk by 2050
- 89,700 properties at almost certain risk by 2050
Which Areas of Illinois Are Most At-Risk of Flooding?
In some areas of Illinois, a huge percentage of properties are at risk of flooding. Below are the areas of Illinois which have the greatest percentage of properties which were likely to experience flooding (based on 2020 calculations).
- Stickney: 91%
- Burnham: 66%
- Beardstown: 60%
- Palos Hills: 54%
- Midlothian: 51%
- Milan: 45%
- Calumet City: 45%
- Harvey: 44%
Because of climate change, the risk of flooding is increasing in many areas of Illinois. For example, by 2050, an estimated 33% of all properties in Cicero will be at risk of flooding, up from 27% in 2020.
Worst Flood Events in Illinois’s Recent History
Since 2000, Illinois has had four major disaster declarations due to flooding, but the 2019 floods were the worst. The floods started at the beginning of the year because of heavy rainfall. Snow also fell during this time and the snowmelt added to the swollen tributaries. By February, there was flooding along many parts of the Illinois River. The area around Beardstown was particularly hit and many people had to evacuate.
The flooding lasted into July, causing an estimated $6.2 billion in damages in the Midwest. At least four people died in the region.
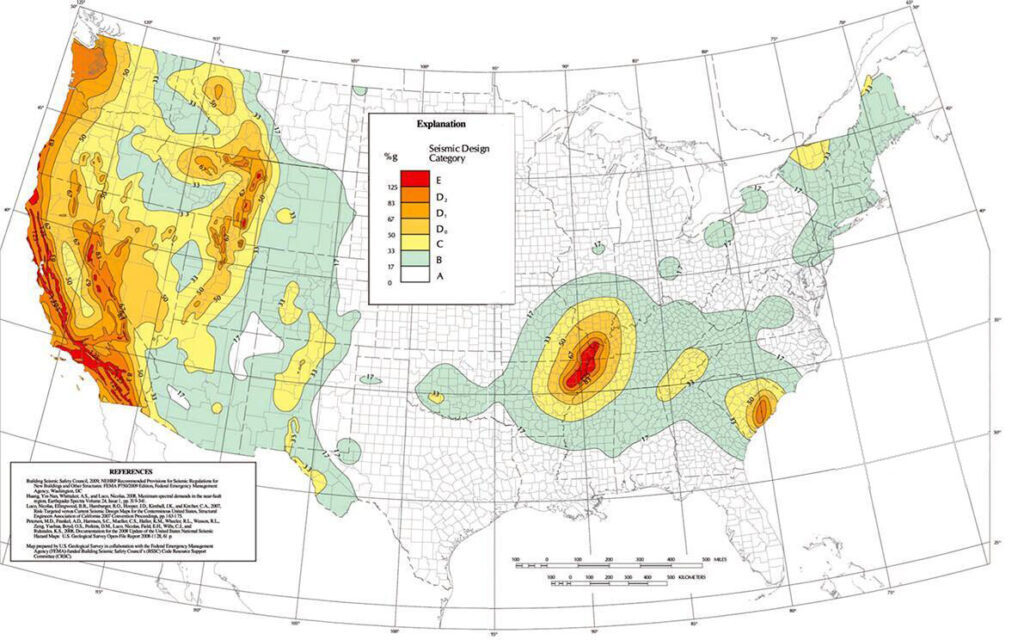
2. Earthquakes
Illinois is located on the New Madrid Seismic Zone (NMSZ). While this zone doesn’t have earthquakes as frequently as those in the Western part of the USA, it has the potential for very large, damaging earthquakes of up to magnitude 7.6.
The NMSZ has approximately 200 earthquakes each year. Most of these are too small to be felt. However, there is an earthquake of magnitude 4.0 or greater in the zone approximately once every 18 months. A magnitude 5.0 quake occurs approximately once every 10 years.
The southern part of Illinois is particularly at-risk for damaging earthquakes, but quakes could affect anywhere in the state.
Since 1994, Illinois has experienced at least five earthquakes of magnitude 4.0 or higher. One of the worst was the 5.4 magnitude quake in Mt. Carmel in 2008. A 5.4 magnitude quake also occurred in Illinois 1968.
3. Tornados
Illinois averages 54 tornadoes per year. While the state has never had an F5 tornado, it has had F4 tornadoes and many F3 tornadoes.
These tornadoes can cause massive amounts of property damage. Since 2000, there have been 16 tornado-related fatalities in the state.
Because of how frequently tornadoes occur and the amount of damage they cause, Illinois ranks ninth in the US in terms of tornado risk.
Also read:
- Best underground tornado shelters
- Above ground tornado shelters
- How to build a tornado shelter for under $3,000
4. Heavy Snowfall and Winter Storms
Illinois has an average of nearly 22 inches of snowfall each year, which ranks it towards the middle in terms of snowfall by state.
However, this number is a bit deceiving because it averages the state as a whole. The northern part of Illinois, especially near the Great Lakes, receives a median of 34.5 inches of snow yearly.
Throughout recorded history, Illinois has also had some massive snowfall events. Since 1912, Illinois has had at least five winters with more than 38 inches of snowfall.
Big cities in Illinois are particularly hard-hit by these snowstorms. In 1968, Chicago got a record 23 inches of snow. The snowfall started on January 26th and quickly shut down O’Hare Airport and schools. By the next day, the city was at a standstill and 20,000 vehicles and over 1,000 buses were stranded. The event cost millions in economic losses and there were at least 60 fatalities.
During the 2011 Groundhog Day blizzard, Chicago was once again shut down. Approximately 1 to 2 feet fell on the city. In the region, the blizzard caused 36 fatalities and an estimated $2.4 billion in damages.
Illinois Winter Weather Stats
- Average snowfall per year: 21.75”
- Snowfall days per year: 29 days
- Coldest recorded temperature: -36F in Congerville on Jan 5th, 1999
- Record snowfall: 44.5” in 1979
5. Freezing Rain
The climate of the Midwest makes it ideal for freezing rain. Illinois doesn’t have freezing rain as frequently as states in the Northeast, but freeze events do occur.
Most parts of Illinois can expect at least 6 hours of freezing rain per year. The central region of Illinois is most at-risk and receives upwards of 15 hours of freezing rain per year.
Freezing rain most frequently occurs during December and January, but fall and spring freeze events also occur.
Icy road conditions from the rain make vehicle accidents and slip and fall injuries common.
It’s also common for people to lose power during freezing rain events, meaning that thousands can be left without a way to heat their homes during the coldest months.
Read:
6. Heat Waves and Droughts
Illinois is part of the “Extreme Heat Belt” in the central United States. This region is very at risk of what the National Weather Service calls “dangerous” and “extremely dangerous” heat days.
A “dangerous” heat day is defined as one where the heat index is 103F and an “extremely dangerous” day has a heat index of 124F or above, which is considered unsafe for all people for any amount of time.
By 2053, an estimated 107 million people in the Extreme Heat Belt will be affected by Extreme Danger days. In Illinois, more than 310,000 are considered vulnerable to extreme heat.
Currently, Illinois has an average of 5 dangerous heat days per year. These heat days can be deadly – like when three seniors died during the 2022 heat wave in Chicago when their air conditioners wouldn’t turn on. By 2050, the average number of dangerous heat days in Illinois is expected to increase to nearly 50 days.
The risk of dangerous heat days is expected to increase throughout all parts of Illinois. Pulaski is one of the most at-risk counties in Illinois for heat waves. By 2053, the county can expect to have at least 56 days per year of temperatures above 107F.
Heat waves are often accompanied by droughts. Because Illinois is an agricultural state, droughts can be particularly devastating for farmers and have a huge economic toll on the state.
7. Wildfires
When it comes to wildfire risk, Illinois is one of the least-at risk states in the USA. However, wildfires still can occur.
In addition to causing property damage, wildfires can affect air quality.
Because of climate change and increased temperatures, the risk of wildfires in Illinois is expected to grow. Residents should make sure they are prepared by having a Go Bag packed with an N95 respirator to protect their lungs.
Illinois Wildfire Stats
- Acres burned in 2021: 219
- Number of fires in 2021: 29
- Average fires per year: 57
- Average acres burned per year: 881
https://www.epa.gov/climate-indicators/climate-change-indicators-heat-waves
https://www.c2es.org/content/heat-waves-and-climate-change/
https://worldpopulationreview.com/state-rankings/average-snowfall-by-state
http://www.usa.com/rank/us–average-snow–state-rank.htm
http://www.usa.com/rank/us–average-snow-days–state-rank.htm
https://clearsurance.com/blog/states-with-most-fatal-winter-crashes
https://www.moneygeek.com/insurance/auto/analysis/worst-states-winter-driving/
https://www.currentresults.com/Weather-Extremes/US/snowiest-day.php
https://www.infoplease.com/math-science/weather/record-lowest-temperatures-by-state
https://www.discovermagazine.com/environment/welcome-to-hail-alley-a-u-s-region-prone-to-pelting-ice
https://www.moneygeek.com/insurance/homeowners/analysis/top-states-for-hail-losses/
https://wgntv.com/weather/weather-blog/where-does-hail-occur-most-often-in-the-united-states/
https://stacker.com/weather/states-most-hailstorms
https://www.verisk.com/insurance/capabilities/weather-risk https://www.iii.org/fact-statistic/facts-statistics-wildfires
https://www.globalforestwatch.org/dashboards/country/USA/11/119
https://www.verisk.com/
https://www.moneygeek.com/insurance/homeowners/analysis/wildfire-statistics/#wildfires-by-state
https://www.geographyrealm.com/geography-hail-united-states/
https://www.weather.gov/media/safety/59-16_State_Ltg_Fatality%2BFatality_Rate_Maps.pdf
https://www.livescience.com/14714-lightning-prone-states-110620.html
https://www.statista.com/statistics/1292499/leading-states-by-total-lightning-count-us/
https://www.earthnetworks.com/blog/states-most-lightning-strikes/
https://www.worldatlas.com/articles/the-five-most-lightning-prone-states-in-the-united-states.html
https://www.moneygeek.com/insurance/homeowners/analysis/top-states-for-hurricane-losses/
https://www.statista.com/statistics/1269483/number-of-hurricanes-that-made-landfall-in-the-us-state/
https://coast.noaa.gov/states
https://assets.firststreet.org/uploads/2020/06/first_street_foundation__first_national_flood_risk_assessment.pdf
https://floodlist.com/